
Saturday, January 28, 2012
Motorcycle Pricelist
Motorcycle transportation is booming in the Philippines, with all the daily traffic experience all over Metro Manila, many opted to utilize motorcycle as their alternate mode of transportation. Despite of danger, many still wants to have a motorcycle, simply because of its versatility, low gas consumption, and can inch their way in every traffic jams in the metro. In addition, more and more people can now afford to own a motorcycle especially those below average earners. In-house financing are readily available from most motorcycle dealers.


Thursday, December 29, 2011
Cacti > Data Sources > RRAs
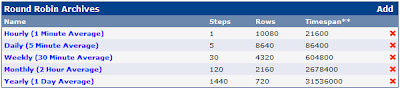
Defining the right RRA Settings is essential if you are customizing how your graph will be displayed. RRAs were set by Steps, Rows and Timespan. These will determine how you keep your data in different intervals and how long would you keep that interval. Manipulating these intervals would require some storage space, the longer you keep the data at a very small interval, the larger space it will require on your storage drive. So proper RRA settings would help you maximize your storage capacity without sacrificing longer period of significant data.
Hourly (1 Minute Average)
Steps - are the number of data points needed to place the data in RRA, (keep in mind that my system is polling every minute)so my value is "1". This means that every minute, the data will be reflected on my graph, but for how long? the answer will be the number of Rows. My value for rows is 10080, this is equivalent to 7 days of 1-minute data.
To get this,
{[10080/(60/1 step)]/24 hours} = 7 days
{[10080/60]/24} = 7 days
Then, what would be my Timespan to display this graph? Timespan value is in seconds, I want to see my 1 minute graph in the last 6 hours, so my value would be 21600 sec = 6 hours

Daily (5 Minute Average)
Steps = 5, This means that the data will be reflected every 5 steps, (which is also equivalent to 5 minutes)
Rows = 8640, using the formula above
{[8640/(60/5 steps)]/24 hours} = 30 days
{[8640/12]/24} = 30 days
Timespan = 86400 sec = 24 hours

Weekly (30 Minute Average)
Steps = 30, This means that the data will be reflected every 30 steps or 30 minutes
Rows = 4320, using the formula
{[4320/(60/30 steps)]/24 hours} = 90 days
{[4320/2]/24} = 90 days
Timespan = 604800 sec = 7 days

Monthly (2-Hour Average)
Steps = 120, This means that the data will be reflected every 120 steps or 120 minutes or 2 hours
Rows = 2160, using the formula
{[2160/(60/120 steps)]/24 hours} = 180 days
{[2160/0.5]/24} = 180 days
Timespan = 2678400 sec = 31 days

Yearly (1 Day Average)
Steps = 1440, This means that the data will be reflected every 1440 steps or 1440 minutes or 24 hours
Rows = 720, using the formula
{[720/(60/1440 steps)]/24 hours} = 720 days
{[720/0.041666666667]/24} = 720 days
Timespan = 31536000 sec = 365 days

In summary, these are the data reflected on my graph.
last 7 days of 1-minute graph
last 30 days of 5-minute graph
last 90 days of 30-minute graph
last 6 months of 2-hour graph
last 2 years of 1-day graph
So every time I zoom in to my graph, I always have those date in every interval.

Hourly (1 Minute Average)
Steps - are the number of data points needed to place the data in RRA, (keep in mind that my system is polling every minute)so my value is "1". This means that every minute, the data will be reflected on my graph, but for how long? the answer will be the number of Rows. My value for rows is 10080, this is equivalent to 7 days of 1-minute data.
To get this,
{[10080/(60/1 step)]/24 hours} = 7 days
{[10080/60]/24} = 7 days
Then, what would be my Timespan to display this graph? Timespan value is in seconds, I want to see my 1 minute graph in the last 6 hours, so my value would be 21600 sec = 6 hours

Daily (5 Minute Average)
Steps = 5, This means that the data will be reflected every 5 steps, (which is also equivalent to 5 minutes)
Rows = 8640, using the formula above
{[8640/(60/5 steps)]/24 hours} = 30 days
{[8640/12]/24} = 30 days
Timespan = 86400 sec = 24 hours

Weekly (30 Minute Average)
Steps = 30, This means that the data will be reflected every 30 steps or 30 minutes
Rows = 4320, using the formula
{[4320/(60/30 steps)]/24 hours} = 90 days
{[4320/2]/24} = 90 days
Timespan = 604800 sec = 7 days

Monthly (2-Hour Average)
Steps = 120, This means that the data will be reflected every 120 steps or 120 minutes or 2 hours
Rows = 2160, using the formula
{[2160/(60/120 steps)]/24 hours} = 180 days
{[2160/0.5]/24} = 180 days
Timespan = 2678400 sec = 31 days

Yearly (1 Day Average)
Steps = 1440, This means that the data will be reflected every 1440 steps or 1440 minutes or 24 hours
Rows = 720, using the formula
{[720/(60/1440 steps)]/24 hours} = 720 days
{[720/0.041666666667]/24} = 720 days
Timespan = 31536000 sec = 365 days

In summary, these are the data reflected on my graph.
last 7 days of 1-minute graph
last 30 days of 5-minute graph
last 90 days of 30-minute graph
last 6 months of 2-hour graph
last 2 years of 1-day graph
So every time I zoom in to my graph, I always have those date in every interval.
Friday, December 23, 2011
Cacti > Installing Plugin Architecture
The Plugin Architecture (PIA) is a set of code changes to core cacti. It is provided by Jimmy Conner (cigamit), one of the Cacti core developers. The Plugin Architecture for Cacti was designed to be both simple in nature and robust enough to allow freedom to do almost anything in Cacti. Cacti itself is designed nicely enough that integrating into it is fairly easy with very little modifications necessary (from here).
In simple terms for us users, it is simply a requirement in order to make the Cacti Plugins work.
Keep in mind that this procedure works on the following versions and on the environment I'm working with, see: My System
***Important Version Compatibility***
Before doing anything, backup your cacti-root-folder just in case you screwed up while making changes on your system.
1. Download cacti-plugin-arch and extract
2. Copy patch file to /var/www and perform patch
3. Edit include/config.php, and change database credentials
4. Configure Plugin Architecture
5. Copy pa.sql on cacti webroot directory and execute import command
Plugin Management should now be found on the left panel of your Cacti page
In some cases, you may encounter errors such as this:
Execute the following commands to get rid of this error.
After doing this, you are now ready to install some of the important plugins such as "realtime", "monitor", "threshold", "spikekill", etc.
In simple terms for us users, it is simply a requirement in order to make the Cacti Plugins work.
Keep in mind that this procedure works on the following versions and on the environment I'm working with, see: My System
***Important Version Compatibility***
cacti_0.8.7g
cacti-plugin-0.8.7g-PA-v2.8
Before doing anything, backup your cacti-root-folder just in case you screwed up while making changes on your system.
1. Download cacti-plugin-arch and extract
#cd /opt
#wget http://mirror.cactiusers.org/downloads/plugins/cacti-plugin-0.8.7g-PA-v2.8.tar.gz
#tar -xzvf cacti-plugin-0.8.7g-PA-v2.8.tar.gz
2. Copy patch file to /var/www and perform patch
#cd cacti-plugin-arch
#cp cacti-plugin-0.8.7g-PA-v2.8.diff /var/www
#cd /var/www/cacti
#patch -p1 -N < /var/www/cacti-plugin-0.8.7g-PA-v2.8.diff
3. Edit include/config.php, and change database credentials
#vi /var/www/cacti/include/config.php
Update "url_path"
$url_path = "/cacti/";
4. Configure Plugin Architecture
- login to Cacti
- User Management > Admin > Realm Permission
- "check" the Plugin Management
- Done
5. Copy pa.sql on cacti webroot directory and execute import command
#cp pa.sql /var/www/cacti
#mysql -u cacti -p cacti < pa.sql
Plugin Management should now be found on the left panel of your Cacti page
In some cases, you may encounter errors such as this:
ERROR 1045 (28000): Access denied for user 'cacti'@'localhost' (using password: YES)
Execute the following commands to get rid of this error.
#cd /var/www/cactiNOTE: on mysql command line, replace the "cacti" with your "cactiuser" if you are using different user for your system
#mysql cacti < pa.sql
#mysql --user=root mysql
mysql> GRANT ALL ON cacti.* TO cacti@localhost IDENTIFIED BY 'cacti';
mysql> flush privileges;
mysql> exit
#mysql -u cacti -p cacti < pa.sql
After doing this, you are now ready to install some of the important plugins such as "realtime", "monitor", "threshold", "spikekill", etc.
Saturday, December 17, 2011
Myth of the Human Body - Philippines

Together with my cousin, we went to this one-of-a-kind exhibit called Myth of the Human Body in Taguig City, Philippines. The exhibit is located at Neobabylon Bldg, 9 Bayani Road, Taguig City. The exhibit is about the method of preserving the human body by the process of plastination. The display showcases the works of Dr. Gunther von Hagens who invented this method for about 2 decades ago. Be warned that exhibit are all real specimens of the dead, which may be disturbing to some others especially children at young age.

It was Dec 5, Monday, when we visit the exhibit. The afternoon was misty, and no other visitors lining at the ticket booth. We got our tickets for P350 each. At the ticket booth, it was clear that we are not allowed to take pictures of the exhibit, mainly because of the controversies surrounding this particular work of Dr. Hagens.
Upon entering the exhibit room, we were approached by the attendant if we want to have a guided tour, or we can roam freely around as long as we want. My cousin and I decided for the second option so we can have more time at every specimen.. after all, there are explanation posted on the backdraft of every specimen that we can read on.
There was an eerie feeling when we started our tour. We were the only visitor that day, the museum was very quiet which adds to a more creepy feeling being the only two of us and all the dead bodies. As we go along stairs-by-stairs, there was an element of surprise and excitement as we don't know what to expect on the next hall of the exhibit. There were a lot of human body parts, every organ, every muscles, every components of the human body is there, sliced, cutted-through, stripped by skin, and dissected. You will just wonder how many dead bodies were processed to have that huge collections. What disturbed me most was the development of an embryo, from it's 1st week up to its 10th month, the samples are estimated to about 30 specimens all in human's early stage of development. The display were all both disturbing and fascinating, one that fascinates me most was the "Red Man", it was a full bodied structure of a human nerves, looking through it makes you realize that we are wired by tiny-delicate nerves all throughout our entire body. I was a bit skeptical about it because I can't figure out how they could extract those from a real body without destroying those tiny-delicate nerves. That is the only display I think is not real, but that's for me, remember we don't have guides to ask about it.
Generally the whole exhibit was an extraordinary presentation of the "Human Body", knowing what it is, and how it works. This is a very rare occasion wherein you can't afford to let it pass. When this exhibit ends on April 2012, it may not come back here again in a long time and you have to go to other countries where this exhibit will be shown next. Though this exhibit may give you a temporary loss of appetite, creepy feeling, and nightmares to some, but it's all worth it. The knowledge you get from this exhibit would definitely make you think before you do harm on your body.
As the end of the exhibit reads:

Those bodies were (not-all) donated by ex-con in China. Some of those may be voluntarily donated willingly, all in the name of "Science"
Subscribe to:
Posts (Atom)