Generally, using Cacti's 1 minute polling can be a great improvement in monitoring your network. Imagine that you can monitor hundreds of host and get their status every minute without exploiting the use of realtime plugin. You can also determine what particular minute did your host change its status from up-to-down and vice-versa. This is also very beneficial in responding for faults quickly, if the host is down in the first minute, you don't need to wait for another 4 minutes just to know that your host is already down. This 4 minutes can be long enough to resolve a minor connection problem. Moreover, 1 minute polling can detect intermittent connection better the 5-minute polling, more often, 5-minute polling can't be an accurate basis for troubleshooting an intermittent connection.
Unfortunately, one critical instance in monitoring every minute is that when most (hundreds or so...) of your host were down, cacti's poller will took longer to poll downed host, and polling won't be completed in just 1 minute, this will cause gaps on some of your graphs where it is not supposed to. The poller will again starts the polling cycle at the end of every 60 seconds without completely polling other host especially those with higher device IDs.
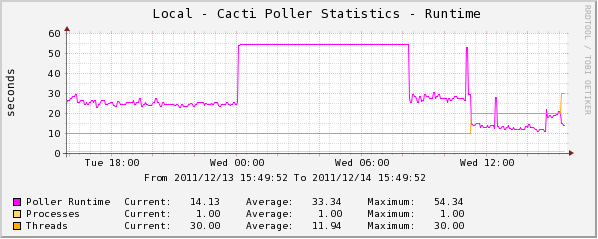
My current fix is to increase the Spine's maximum threads per process by 50% from my current settings, I hope this will be enough to completely poll all host when a major downtime happens again. Cacti's poller stats runtime is down to only less than 15sec from its previous 25sec.
will make you know what I know, but don't think you know me all, what I know might be more than what you know..
Showing posts with label 1. Show all posts
Wednesday, December 14, 2011
Saturday, November 26, 2011
Cacti > 1 Minute Polling Using Spine
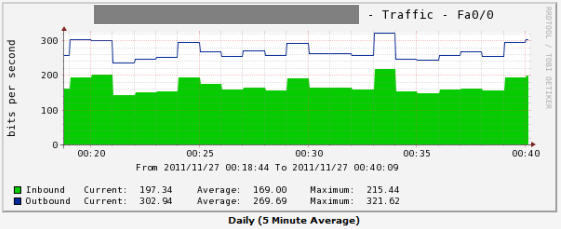
Just this morning, after about a week working on how to make my Cacti system poll every minute, I finally pulled it off. The procedure was simple but a bit long, I did only adjustment the cron jobs and series of configuration on Cacti's web interface.
Here are my general procedure on how I make it work
1. Edit cron to run /var/www/cacti/poller.ph every minute
2. On your Cacti web interface - Console > Data Templates
3. Change the template "step" to 60 (this is in seconds = this is already the 1 minute polling interval)
4 Change "heartbeat" to 120 for both traffic_in and traffic_out and save
5. Go to Console > Cacti Settings > Poller tab
6. Change the Poller Interval and Cron Interval to "Every Minute" and save
7. On Console > Utilities , click on Rebuild Poller Cache
8. You can also run php poller.php on your cacti folder
9. Verify if your cron is working by checking the cacti.log
10. On Console > Data Sources > RRAs, define the number of rows you want to maintain a 1 minute data
11. Create a new graph using the "Interface Traffic" template, so will see that your graph will display a 1 minute worth of data gathered.
Note: For those existing graph with 5-min polling interval, you need to re-create the graph or just simply delete the associated rrd files, thus losing your historical data.
Cheers!!!.. for now I will go out and celebrate my self!.. :)
Related Posts:
- Setting-up your RRAs
- Installing Spine
- 1 minute polling drawback
Here are my general procedure on how I make it work
1. Edit cron to run /var/www/cacti/poller.ph every minute
#crontab -e
*/1 * * * * php /var/www/cacti/poller.php > /dev/null 2>&1
2. On your Cacti web interface - Console > Data Templates
3. Change the template "step" to 60 (this is in seconds = this is already the 1 minute polling interval)
4 Change "heartbeat" to 120 for both traffic_in and traffic_out and save
5. Go to Console > Cacti Settings > Poller tab
6. Change the Poller Interval and Cron Interval to "Every Minute" and save
7. On Console > Utilities , click on Rebuild Poller Cache
8. You can also run php poller.php on your cacti folder
#php poller.php
9. Verify if your cron is working by checking the cacti.log
10. On Console > Data Sources > RRAs, define the number of rows you want to maintain a 1 minute data
11. Create a new graph using the "Interface Traffic" template, so will see that your graph will display a 1 minute worth of data gathered.
Note: For those existing graph with 5-min polling interval, you need to re-create the graph or just simply delete the associated rrd files, thus losing your historical data.
Cheers!!!.. for now I will go out and celebrate my self!.. :)
Related Posts:
- Setting-up your RRAs
- Installing Spine
- 1 minute polling drawback
Subscribe to:
Posts (Atom)